
Wi-Fi Weather Station with Local Display: Complete DIY Guide
Transform your home into a smart weather monitoring hub with a Wi-Fi Weather Station featuring a Local Display. This comprehensive guide walks you through building a powerful, affordable IoT weather station using the ESP8266 NodeMCU, precision environmental sensors, and a crisp OLED display. Whether you are a hobbyist, student, or electronics enthusiast, this project delivers real-time temperature, humidity, barometric pressure, and altitude readings -- all viewable both on a local screen and remotely via your Wi-Fi network.
What Is a Wi-Fi Weather Station with Local Display?
A Wi-Fi Weather Station with Local Display is an intelligent environmental monitoring system that collects real-time weather data from multiple sensors and presents it simultaneously on two interfaces: a physical display unit located in your home and a digital dashboard accessible through your local Wi-Fi network or the internet. Unlike basic digital thermometers that only show temperature, these advanced stations measure multiple atmospheric parameters including temperature, relative humidity, barometric pressure, rainfall, wind speed, and UV index.
The local display component is what sets these stations apart from pure cloud-based solutions. It provides an always-visible screen -- typically an LCD, TFT, or OLED display -- showing current conditions at a glance without needing to unlock a smartphone or open an application. The Wi-Fi connectivity adds remote monitoring capabilities, data logging, historical trend analysis, and integration with popular weather platforms like Weather Underground or OpenWeatherMap.
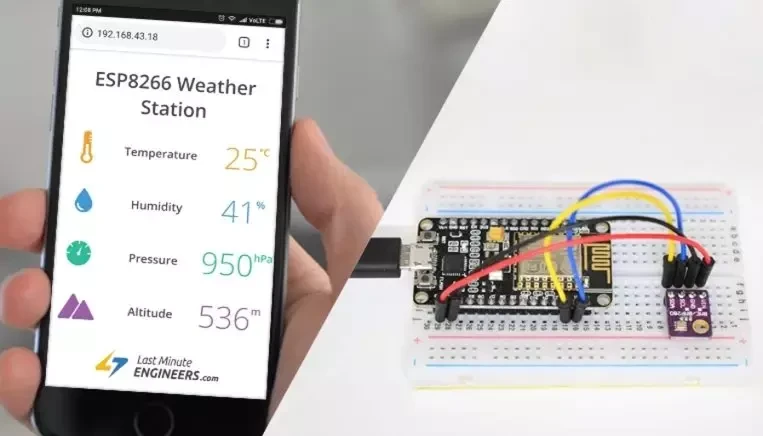
Fig 1: ESP8266 NodeMCU interfaced with BME280 environmental sensor for accurate weather monitoring
How Does a Wi-Fi Weather Station Work?
The architecture of a Wi-Fi Weather Station with Local Display consists of three primary subsystems working in harmony:
1. Sensor Array (Data Collection)
The outdoor and indoor sensor units continuously sample environmental variables. Common sensors include:
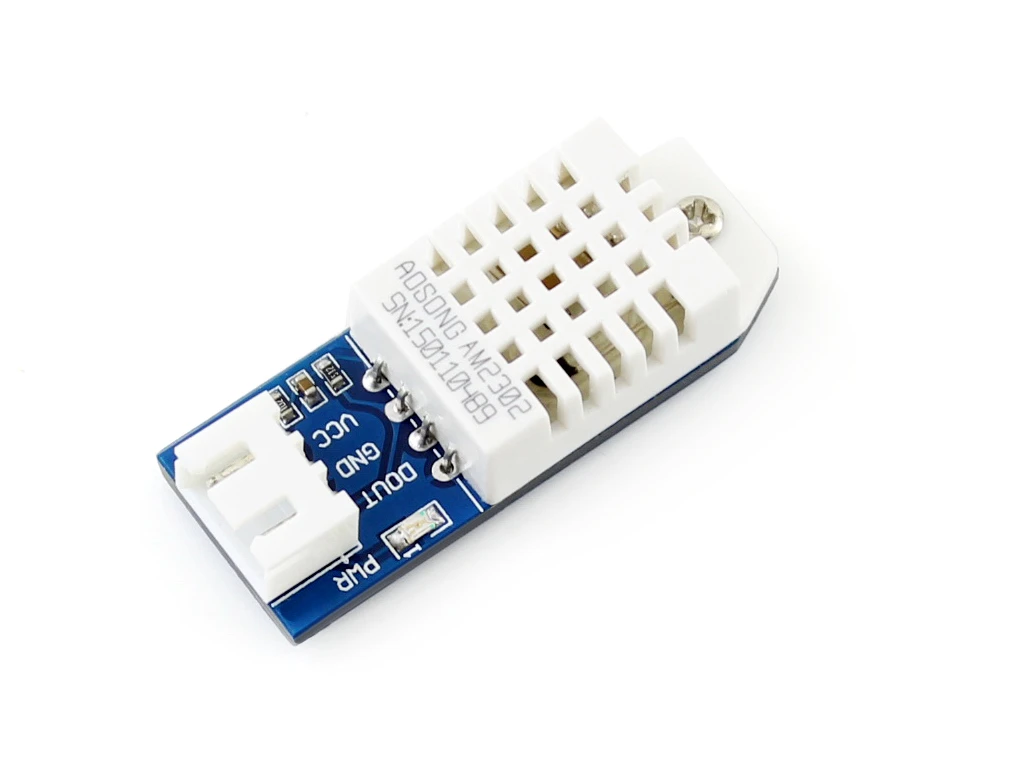
- Temperature & Humidity Sensors (DHT22, DHT11, SHT30) -- Measure ambient temperature in Celsius or Fahrenheit and relative humidity as a percentage.
- Barometric Pressure Sensors (BMP280, BME280) -- Detect atmospheric pressure changes used for weather forecasting and altitude calculation.
- Wind Sensors -- Anemometers measure wind speed; wind vanes determine wind direction.
- Rain Gauges -- Tipping bucket mechanisms record cumulative rainfall in millimetres or inches.
- Light & UV Sensors (LDR, SI1145) -- Monitor solar radiation intensity and ultraviolet index.
2. Microcontroller Unit (Data Processing)
The ESP8266 NodeMCU serves as the brain of the weather station. This low-cost Wi-Fi-enabled microcontroller reads sensor data via I2C, SPI, or One-Wire protocols, processes the raw values into human-readable formats, and manages two simultaneous output streams: the local display and the network interface.
Key responsibilities of the microcontroller include:
- Polling sensors at regular intervals (typically every 2 to 10 seconds).
- Applying calibration offsets to improve measurement accuracy.
- Calculating derived metrics such as dew point, heat index, and sea-level pressure.
- Updating the local OLED/LCD display with formatted data and icons.
- Serving a web dashboard via the built-in HTTP server.
- Uploading data to cloud services (optional: ThingSpeak, OpenWeatherMap, or MQTT brokers).
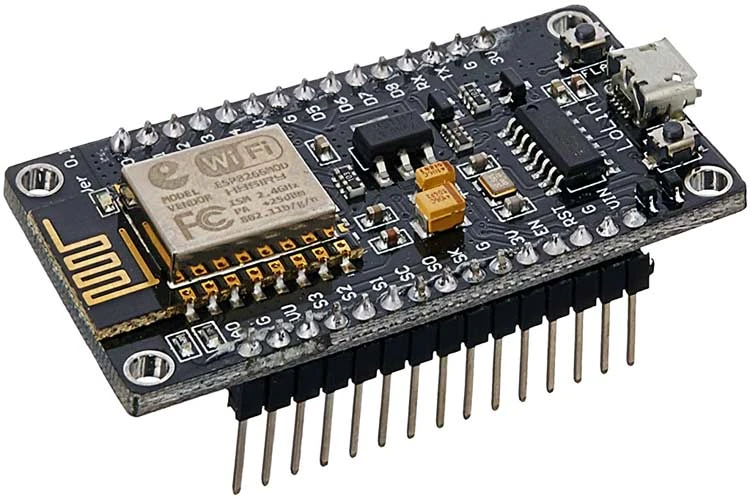
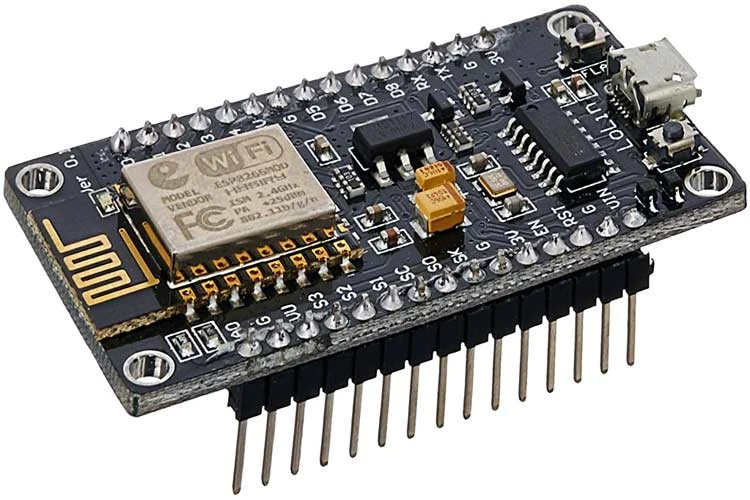
Fig 2: NodeMCU ESP8266 Development Board -- the powerful Wi-Fi microcontroller at the heart of this project
3. Local Display Unit (Data Visualization)
The local display acts as your in-home weather dashboard. OLED displays are particularly popular for DIY weather stations because they offer:
- High contrast ratios with deep blacks and bright characters.
- Wide viewing angles readable from almost any position.
- Low power consumption ideal for always-on operation.
- Fast refresh rates capable of showing smooth animations and live icons.
- Compact form factors that fit elegantly on a desk or wall mount.
Typical screen layouts organize data into logical zones: current outdoor temperature prominently at the top, humidity and pressure readings in side columns, a 3-day forecast row at the bottom, and a status bar showing Wi-Fi signal strength and the current time synced via NTP.

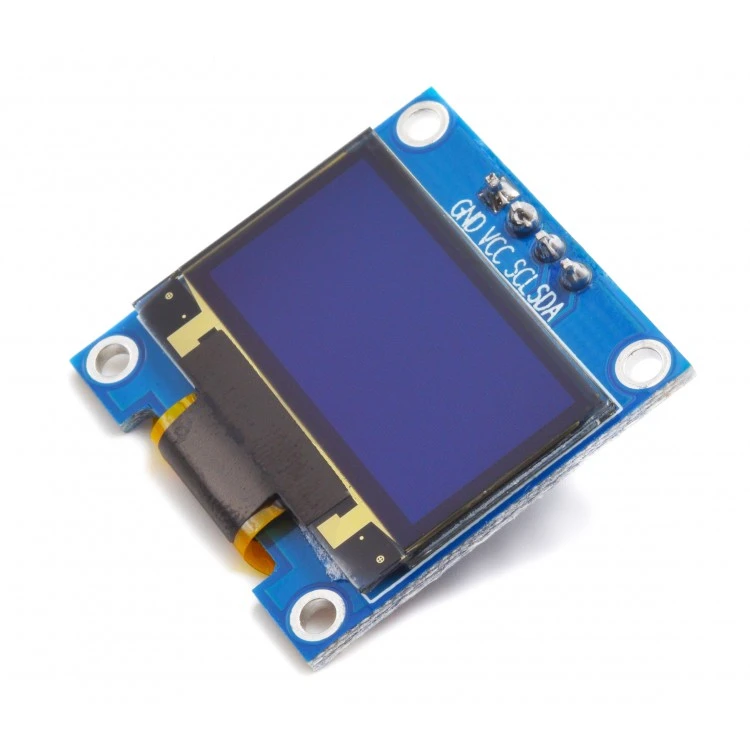
Fig 3: NodeMCU-based weather station displaying live temperature, humidity, and pressure on a 0.96-inch OLED screen
Components Required for This Project
Building your own Wi-Fi Weather Station with Local Display requires the following electronic components. All items are readily available from the FlyRobo store and compatible with Arduino IDE and PlatformIO development environments.
| Component | Specification | Purpose |
|---|---|---|
| NodeMCU ESP8266 | ESP-12E Module, 4MB Flash | Main microcontroller with built-in Wi-Fi |
| OLED Display | 0.96 inch, 128x64 pixels, I2C interface | Local visual output for weather data |
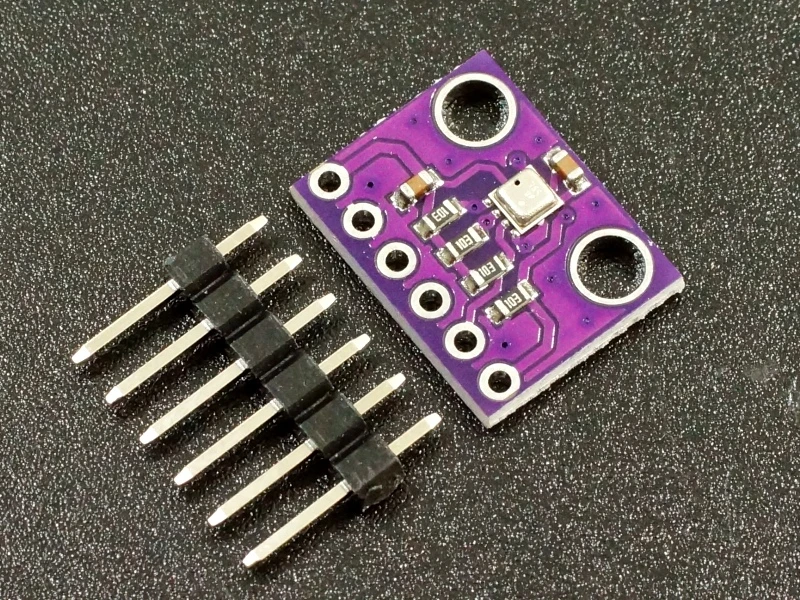
| BME280 Sensor | I2C/SPI, 3.3V logic level | Measures temperature, humidity, and pressure |
| DHT22 Sensor | Digital output, single-wire protocol | Secondary temperature and humidity validation |
| Jumper Wires | Female-to-female, 20cm length | Quick breadboard connections |
| Breadboard | 830 tie-points, standard size | Prototyping and circuit assembly |
| Micro USB Cable | Data + Power capable | Programming and 5V power supply |
| Enclosure (Optional) | 3D-printed or ABS plastic case | Protective housing for indoor unit |
Circuit Diagram and Wiring Connections
The wiring for this Wi-Fi Weather Station is straightforward because all major components communicate over the I2C bus, requiring only four shared connections. The DHT22 uses a separate digital pin.
I2C Bus Connections (Shared by OLED and BME280)
| NodeMCU Pin | Connected To | Wire Colour (Suggested) |
|---|---|---|
| 3.3V | VCC on OLED and BME280 | Red |
| GND | GND on OLED and BME280 | Black |
| D1 (GPIO 05) | SCL on OLED and BME280 | Yellow |
| D2 (GPIO 04) | SDA on OLED and BME280 | Green |
DHT22 Digital Connection
- VCC pin of DHT22 --> 3.3V on NodeMCU
- GND pin of DHT22 --> GND on NodeMCU
- DATA pin of DHT22 --> D4 (GPIO 02) on NodeMCU
Arduino Source Code
Upload the following sketch to your NodeMCU using the Arduino IDE. Ensure you have installed the required libraries: Adafruit_BME280, Adafruit_SSD1306, Adafruit_GFX, and DHT. Add your Wi-Fi credentials in the designated section.
Step-by-Step Assembly Instructions
Step 1: Prepare the Development Environment
- Install the Arduino IDE (version 1.8.x or 2.x) from the official Arduino website.
- Add ESP8266 board support via File --> Preferences --> Additional Board Manager URLs. Paste:
https://arduino.esp8266.com/stable/package_esp8266com_index.json - Open Tools --> Board --> Board Manager, search for "ESP8266", and install the package.
- Select "NodeMCU 1.0 (ESP-12E Module)" from Tools --> Board menu.
- Install required libraries through Sketch --> Include Library --> Manage Libraries:
- Adafruit BME280 Library
- Adafruit SSD1306 Library
- Adafruit Unified Sensor
- DHT sensor library by Adafruit
Step 2: Breadboard Prototyping
- Insert the NodeMCU into the breadboard, straddling the centre divider so pins sit on both sides.
- Connect the BME280 module to the I2C bus: VCC to 3.3V, GND to GND, SCL to D1, SDA to D2.
- Connect the OLED display to the same I2C bus lines (parallel connection).
- Insert the DHT22 sensor and wire DATA to D4, VCC to 3.3V, GND to GND.
- Place a 10k Ohm pull-up resistor between the DHT22 DATA pin and VCC for signal stability (many breakout modules include this resistor onboard).
Step 3: Firmware Upload
- Connect the NodeMCU to your computer using a quality micro USB data cable.
- Copy the provided source code into a new Arduino sketch.
- Replace
YOUR_WIFI_SSIDandYOUR_WIFI_PASSWORDwith your actual network credentials. - Click the Upload button (right arrow icon) and wait for the "Done uploading" message.
- Open the Serial Monitor at 115200 baud to confirm successful Wi-Fi connection and IP assignment.
Step 4: Local Display Testing
- Within seconds of power-up, the OLED should illuminate showing the startup sequence.
- Verify that temperature and humidity readings appear reasonable (compare with a household thermometer).
- Blow gently on the BME280 sensor -- the humidity value should spike within 5 seconds, confirming live data.
- Press the RESET button on NodeMCU to test restart behaviour and boot-time Wi-Fi reconnection.
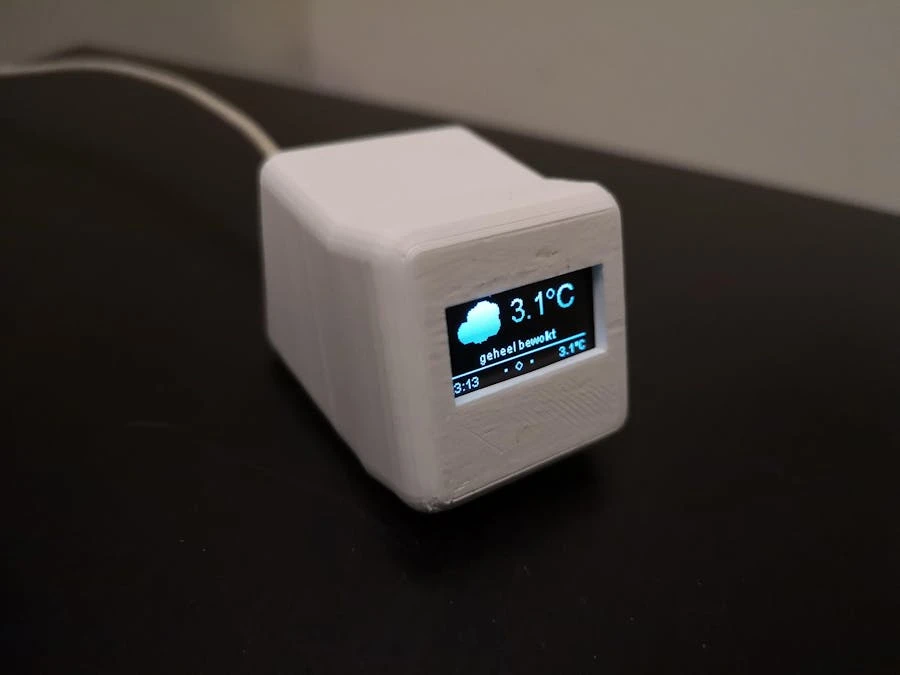
Fig 4: A finished Wi-Fi Weather Station housed in a custom 3D-printed case, ready for desktop or shelf placement
Advanced Features and Enhancements
Once your basic weather station is operational, consider these upgrades to expand functionality and improve usability:
Data Logging to SD Card
Add a microSD card module to log timestamped weather readings every minute. Historical data enables trend analysis, seasonal comparisons, and long-term climate observation for your exact location. Use the SD.h library and format data as comma-separated values (CSV) for easy import into Microsoft Excel or Google Sheets.
Threshold Alerts via Blynk or Telegram
Integrate the Blynk IoT platform to receive push notifications when temperature exceeds a set threshold or rainfall begins. Alternatively, use the Telegram Bot API to send weather alerts to your smartphone for free, without relying on third-party IoT dashboards.
Upload to Weather Underground
Register a free Weather Underground Personal Weather Station (PWS) account. Configure your NodeMCU to POST data to the Weather Underground API using the ESP8266HTTPClient library. Your backyard station then contributes to global meteorological datasets while giving you access to professional-grade analytics.
Solar Power for Outdoor Unit
For the outdoor sensor array, pair a 5V solar panel with a 18650 lithium-ion battery and TP4056 charging module. This eliminates wiring runs to remote sensor locations and maintains operation during power outages. Size the panel to provide at least 500mA in peak sunlight for reliable overnight operation.
Calibration and Accuracy Tips
Consumer-grade sensors can drift over time. Achieve professional-level accuracy with these calibration techniques:
- Temperature Offset: Place your BME280 and a calibrated medical thermometer in a sealed container for 30 minutes. Record the difference and apply a fixed offset in software.
- Humidity Salt Test: Saturated table salt (NaCl) maintains exactly 75% relative humidity at room temperature. Seal the sensor with salt paste in a bag for 8 hours, then adjust the reading via calibration register.
- Pressure Reference: Compare barometric readings with your nearest airport METAR report (available online). Adjust the sea-level reference pressure in
readAltitude()accordingly. - Sensor Placement: Mount outdoor sensors inside a Stevenson screen (a louvered radiation shield) positioned 1.2 to 2.0 metres above ground on grass or natural terrain. Avoid placing sensors near concrete, asphalt, or building walls that radiate heat.
Troubleshooting Common Issues
| Symptom | Possible Cause | Solution |
|---|---|---|
| OLED remains blank | Incorrect I2C address | Run an I2C scanner sketch. Try addresses 0x3C and 0x3D. |
| BME280 returns "nan" | Wrong I2C address or wiring fault | Verify wiring; test with addresses 0x76 and 0x77. |
| DHT22 reads "nan" | Timing issue or insufficient pull-up | Add 10k resistor between DATA and VCC; check pin mapping. |
| Wi-Fi connection fails | 2.4 GHz network required | ESP8266 does not support 5 GHz. Enable 2.4 GHz on router. |
| Web page not loading | Firewall or IP changed | Reserve IP via router DHCP settings; verify port 80 is open. |
| Readings fluctuate wildly | Electrical noise or loose wires | Use shorter wires; add 100nF ceramic capacitor near sensor VCC/GND. |
Why Choose a Local Display Over App-Only Stations?
Many commercial weather stations rely entirely on smartphone applications for data viewing. While convenient, this approach introduces several practical limitations that a local display elegantly solves:
- Instant Accessibility: A physical display on your desk or wall requires zero interaction -- just glance over. Elderly family members, children, and guests can read conditions without installing apps or knowing Wi-Fi passwords.
- Network Independence: If your internet connection drops or the cloud server experiences downtime, the local display continues functioning. Only Wi-Fi Weather Stations with Local Display offer this essential redundancy.
- Always-On Visibility: Unlike phone screens that dim and lock, an OLED or TFT display stays continuously illuminated. Mount it in the kitchen, workshop, or greenhouse for ambient environmental awareness.
- Lower Power Consumption: Checking weather on a phone means waking the device, loading an app, and keeping the screen active. A dedicated display consumes mere milliamps and operates for weeks on battery backup.
- Privacy: Your weather data remains within your home network. No third-party company profiles your habits, sells your location data, or forces firmware updates that remove features.
Where to Buy Quality Components in India
FlyRobo.in stocks all the components mentioned in this guide, sourced from reputable manufacturers and tested for compatibility with Arduino and ESP8266 platforms. When you purchase from FlyRobo, you benefit from:
- Genuine ESP8266 NodeMCU modules with CP2102 USB-to-UART bridge.
- Pre-soldered BME280 modules with both I2C and SPI pin headers.
- SSD1306 OLED displays tested for uniform brightness and dead-pixel-free panels.
- Full technical support via email for wiring and coding questions.
- Fast shipping across India with cash-on-delivery options available.
Learning Outcomes
By completing this Wi-Fi Weather Station with Local Display project, you will have gained practical skills in:
- Interfacing multiple I2C devices (OLED and BME280) to a single microcontroller bus.
- Reading digital one-wire protocols (DHT22) with timing-critical precision.
- Programming ESP8266 Wi-Fi connectivity using the Arduino core.
- Hosting embedded web servers that serve dynamic HTML dashboards.
- Applying sensor fusion techniques to improve measurement reliability.
- Designing low-power, always-on IoT devices for home automation.
Conclusion
Building a Wi-Fi Weather Station with Local Display is one of the most rewarding entry-level IoT projects for Indian electronics enthusiasts. It combines sensor interfacing, wireless networking, and user interface design into a single practical device that serves your household daily. With components costing under 1,500 rupees and code that is freely extensible, this project demonstrates that sophisticated smart home technology is accessible to everyone.
Start your build today by ordering the core components from FlyRobo.in, follow the wiring diagram carefully, and upload the provided sketch. Within one hour, you will have a functioning weather station that rivals commercial products costing ten times as much -- with the added satisfaction of having built it yourself.
Published: May 2026 | Author: FlyRobo Technical Team | Category: IoT & Home Automation | Tags: ESP8266, NodeMCU, BME280, DHT22, OLED, Weather Station, DIY Electronics

Leave a Comment